With neural networks or regressions analyze the performance of a team or player can be related to the probability of a match outcome. There is no need of programming the knowledge. The network learns from examples. These techniques have wide application in industry. Banks-institutes use them to predict the Stocks and Bond rats. They use neural networks for predict bankruptcy or credit worthiness. In telecommunication it is used for the predict which customer are probably leave in the near future (Churn). On the most problems they outperform human experts. In the sport betting domain several scientist suggest that neural network/regression are at least as good as expert tipsters.
The first step in model building is to look at available history matches (some sport sites on the internet provide such data).
In the next step the input variables have to be chosen (the feature must be available before the prediction is made (for example the weather condition is normally not available when you calculate the prediction)). To predict the outcome of sport matches the profile of the teams or players where used (win ratio, days between last matches...). As output variable the match outcome (1=win, 0=lose) can be used.
In the final step the data is split in tow sets, one set is used to adapt the neural network/Regressions model to the data and the second to evaluate the prediction performance of the model.
Example ATP men's Tennis matches: The data set include matches from 1999 to Jan. 2003. As input the win ratio for the last 20 games, independent from the surface (clay/grass/hard), and the win ratio of the last 20 games played on the same surface as the predicted match, for each player is used.
As output variable the match outcome (1=win, 0=lose) is used.
|
Not used |
Not used |
Input1 |
Input2 |
Input3 |
Input4 |
Output |
|
|
PlayerA |
PlayerB |
AWin |
Awin-surface |
BWin |
Bwin-surface |
Win |
|
|
Patrick Rafter |
Takao Suzuki |
0,75 |
0,95 |
0,5 |
0 |
1 |
|
|
Jim Courier |
Slava Dosedel |
0,5 |
0,4545 |
0,4 |
0,375 |
0 |
|
|
Andrew Ilie |
Jiri Novak |
0,4 |
0,3 |
0,55 |
0,3333 |
0 |
|
|
Lleyton Hewitt |
Nicolas Kiefer |
0,38 |
0,2857 |
0,55 |
0,65 |
1 |
|
|
Arnaud Di |
Jason Stoltenberg |
0,55 |
0,3333 |
0,5 |
0,3636 |
0 |
|
|
Gianluca Pozzi |
Todd Woodbridge |
0,4 |
0,45 |
0,45 |
0,4615 |
1 |
|
|
Andrei Pavel |
Mikael Tillstrom |
0,3 |
0,6667 |
0,4 |
0,5714 |
1 |
|
|
Byron Black |
Vince Spadea |
0,45 |
0,65 |
0,55 |
0,5625 |
1 |
|
As prediction model a Logistic Regression model was used. To fit the model 17110 matches was used. For testing 1000 matches keep back.
Results:
Classification Trainings data : 62.52 % (17110 matches)
Classification Test data : 59.5 % (1000 matches)
If we restrict the classification to Grand Slam matches:
Classification Trainings data : 67.25 % (3072 matches)
Classification Test data : 70.1 % (194 matches)
To get more insight in to the model it is often helpful to plot the model. The following graphs show the model outcome for players with plays on all surfaces equal (Winn ratio all surface = win ratio surface next game)
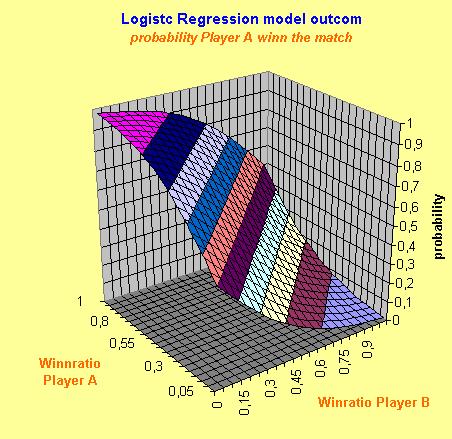
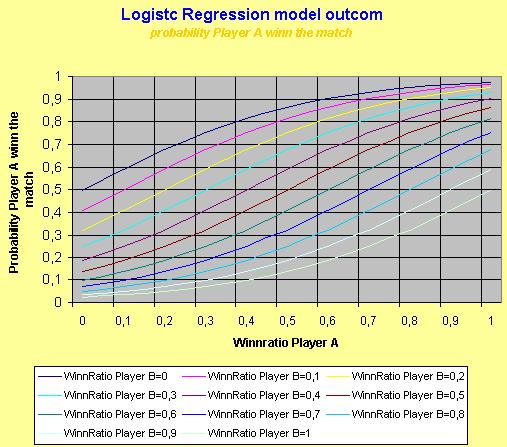
To get more accurate prediction you have to take in to account more features of the players' profile. Another problem is the noise in the data. To estimate the real performance of the system a lot of matches (datasets) are necessary to get an accurate estimate.
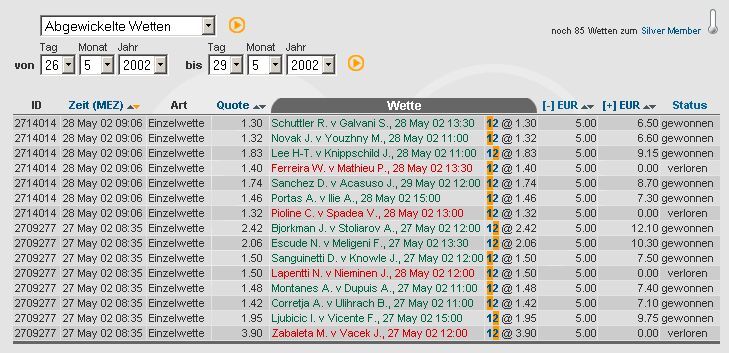
At the French Open 2002 I do some experiments. With a neural network the win-probability was predicted. I placed 15 bets with a 5 Euro stake. From the 15 bets I lose 4, this was profit from 17.4 Euro. I stopt betting after the 15 placed bets because it was lot of work to get verry mornig the actual data (games playt last day, and quots form the bookmaker) and calculat the win probability. The experiment is NOT statistical significant but for me it was intresting to see that the method in principel works.